1. 序 今天得到大佬的指点”其实JVM问题没你想的那么难,写一段代码拿到服务器上复现就可以排查了”。
醒悟了,确实,一直以来把JVM的问题想的过于高深,以至于都没有实践去排查一下问题,光了解一些理论有什么用呢,至少简单的问题要能下手,复杂的问题有思路知道怎么去找方向。
好了,下面就来简要分析下排查线上问题
2. 环境准备 首先安装jdk,如果是服务器上安装的话注意安装工具,centos yum安装除了安装jdk外还要安装devtool
windows上的话自带了,就不存在了,不过用自己的物理机得注意一下设置内存,别把自己卡死了。
1
2
yum install -y java-1.8.0-openjdk yum install -y java-1.8.0-openjdk-devel
3. 死锁检查 3.1. 代码准备 准备一个死循环的代码,vim 新建T1Deadlock.java就可以了
1
2
3
4
5
6
7
8
9
10
11
12
13
14
15
16
17
18
19
20
21
22
23
24
25
26
27
28
29
30
31
32
33
34
35
36
public class T1Deadlock { static final Object o1 = new Object (); static final Object o2 = "o2" ; public static void main (String[] args) { Thread thread1 = new Thread (() -> { synchronized (o1) { System.out.println("锁定o1" ); sleep(5000 ); synchronized (o2) { System.out.println("锁定o2" ); } } }); Thread thread2 = new Thread (() -> { synchronized (o2) { System.out.println("锁定o2" ); sleep(5000 ); synchronized (o1) { System.out.println("锁定o1" ); } } }); thread1.start(); thread2.start(); } private static void sleep (int millis) { try { Thread.sleep(millis); } catch (InterruptedException e) { throw new RuntimeException (e); } } }
这里需要注意不需要导入包,如package com...别加,(如果你使用了,那么后续java运行的时候得有对应的目录)。这样我们直接在java文件目录运行就好了
然后Javac编译
得到T2CPUFull.calss文件,然后后台运行
这样就准备好一个死锁环境了
3.2. 查看问题进程 top查看进程,找到对应进程pidps -ef | grep java,查看pidjps 查看对应的pid3521
3.3. 查看栈快照 查看stack.log,内容有关于死锁的
1
2
3
4
5
6
7
8
9
10
11
12
13
14
15
16
17
18
19
20
21
22
23
24
25
26
27
28
29
JNI global references: 310 Found one Java-level deadlock: ============================= "Thread-1": waiting to lock monitor 0x00007f1d50003988 (object 0x00000000d75e2dd0, a java.lang.Object), which is held by "Thread-0" "Thread-0": waiting to lock monitor 0x00007f1d50006218 (object 0x00000000d75e2de0, a java.lang.String), which is held by "Thread-1" Java stack information for the threads listed above: =================================================== "Thread-1": at T1Deadlock.lambda$main$1(T1Deadlock.java:22) - waiting to lock <0x00000000d75e2dd0> (a java.lang.Object) - locked <0x00000000d75e2de0> (a java.lang.String) at T1Deadlock$$Lambda$2/303563356.run(Unknown Source) at java.lang.Thread.run(Thread.java:750) "Thread-0": at T1Deadlock.lambda$main$0(T1Deadlock.java:13) - waiting to lock <0x00000000d75e2de0> (a java.lang.String) - locked <0x00000000d75e2dd0> (a java.lang.Object) at T1Deadlock$$Lambda$1/471910020.run(Unknown Source) at java.lang.Thread.run(Thread.java:750) Found 1 deadlock.
可以找到Found one Java-level deadlock:很直观的就可以看到死锁的问题了。
4. CPU占用100% 4.1. 准备环境 准备一段代码,vim 新建T2CPUFull.java就可以了
1
2
3
4
5
6
7
8
9
10
11
12
13
public class T2CPUFull { public static void main (String[] args) { Thread highCpuThread = new Thread (() -> { int i = 0 ; while (true ) { i++; } }); highCpuThread.setName("HighCpu" ); highCpuThread.start(); } }
这里需要注意不需要导入包,如package com...别加,(如果你使用了,那么后续java运行的时候得有对应的目录)。这样我们直接在java文件目录运行就好了
然后Javac编译
得到T2CPUFull.calss文件,然后后台运行
这样就准备好环境了,此时cpu已经100%了
4.2. top 命令查看进程 top查看
1
2
3
4
5
6
7
8
PID USER PR NI VIRT RES SHR S %CPU %MEM TIME+ COMMAND 3160 root 20 0 6446036 32352 11808 S 100.0 0.4 0:37.93 java 367 root 20 0 0 0 0 S 0.3 0.0 0:01.11 kworker/6:2 1234 root 20 0 1799684 31300 13124 S 0.3 0.4 0:08.54 containerd 3206 root 20 0 162128 2404 1588 R 0.3 0.0 0:00.04 top 1 root 20 0 193724 6808 4180 S 0.0 0.1 0:03.44 systemd 2 root 20 0 0 0 0 S 0.0 0.0 0:00.04 kthreadd 4 root 0 -20 0 0 0 S 0.0 0.0 0:00.00 kworker/0:0H
此时对应的进程ID为3160
4.3. 查看线程 现在要把进程所有的线程拉下来看
jstack 3160 > stack.log
这样就保存了线程栈快照
4.4. 查看进程内部线程情况 再找到占用最大的线程
top -Hp 3160
1
2
3
4
5
6
7
8
9
10
11
12
13
14
15
16
17
18
19
20
21
22
23
24
25
26
27
28
29
30
31
32
33
34
35
36
PID USER PR NI VIRT RES SHR S %CPU %MEM TIME+ COMMAND 3203 root 20 0 6446036 73168 11808 R 99.9 0.9 4:15.87 HighCpu 3160 root 20 0 6446036 73168 11808 S 0.0 0.9 0:00.00 java 3161 root 20 0 6446036 73168 11808 S 0.0 0.9 0:00.12 java 3162 root 20 0 6446036 73168 11808 S 0.0 0.9 0:00.00 GC task thread# 3163 root 20 0 6446036 73168 11808 S 0.0 0.9 0:00.00 GC task thread# 3164 root 20 0 6446036 73168 11808 S 0.0 0.9 0:00.00 GC task thread# 3165 root 20 0 6446036 73168 11808 S 0.0 0.9 0:00.00 GC task thread# 3166 root 20 0 6446036 73168 11808 S 0.0 0.9 0:00.00 GC task thread# 3167 root 20 0 6446036 73168 11808 S 0.0 0.9 0:00.00 GC task thread# 3168 root 20 0 6446036 73168 11808 S 0.0 0.9 0:00.00 GC task thread# 3169 root 20 0 6446036 73168 11808 S 0.0 0.9 0:00.00 GC task thread# 3170 root 20 0 6446036 73168 11808 S 0.0 0.9 0:00.00 GC task thread# 3171 root 20 0 6446036 73168 11808 S 0.0 0.9 0:00.00 GC task thread# 3172 root 20 0 6446036 73168 11808 S 0.0 0.9 0:00.00 GC task thread# 3173 root 20 0 6446036 73168 11808 S 0.0 0.9 0:00.00 GC task thread# 3174 root 20 0 6446036 73168 11808 S 0.0 0.9 0:00.00 GC task thread# 3175 root 20 0 6446036 73168 11808 S 0.0 0.9 0:00.01 VM Thread 3176 root 20 0 6446036 73168 11808 S 0.0 0.9 0:00.00 Reference Handl 3177 root 20 0 6446036 73168 11808 S 0.0 0.9 0:00.00 Finalizer 3178 root 20 0 6446036 73168 11808 S 0.0 0.9 0:00.00 Signal Dispatch 3179 root 20 0 6446036 73168 11808 S 0.0 0.9 0:00.00 C2 CompilerThre 3180 root 20 0 6446036 73168 11808 S 0.0 0.9 0:00.00 C2 CompilerThre 3181 root 20 0 6446036 73168 11808 S 0.0 0.9 0:00.01 C2 CompilerThre 3182 root 20 0 6446036 73168 11808 S 0.0 0.9 0:00.01 C2 CompilerThre 3183 root 20 0 6446036 73168 11808 S 0.0 0.9 0:00.00 C2 CompilerThre 3184 root 20 0 6446036 73168 11808 S 0.0 0.9 0:00.00 C2 CompilerThre 3185 root 20 0 6446036 73168 11808 S 0.0 0.9 0:00.00 C2 CompilerThre 3186 root 20 0 6446036 73168 11808 S 0.0 0.9 0:00.00 C2 CompilerThre 3187 root 20 0 6446036 73168 11808 S 0.0 0.9 0:00.02 C1 CompilerThre 3188 root 20 0 6446036 73168 11808 S 0.0 0.9 0:00.02 C1 CompilerThre 3189 root 20 0 6446036 73168 11808 S 0.0 0.9 0:00.02 C1 CompilerThre 3190 root 20 0 6446036 73168 11808 S 0.0 0.9 0:00.02 C1 CompilerThre 3191 root 20 0 6446036 73168 11808 S 0.0 0.9 0:00.00 Service Thread 3192 root 20 0 6446036 73168 11808 S 0.0 0.9 0:00.17 VM Periodic Tas 3193 root 20 0 6446036 73168 11808 S 0.0 0.9 0:00.00 thread-0
这里的PID是进程内的线程ID了,之前top查看的是linux进程ID
可以看到线程3203cpu占用最高
将其转换为16进制printf "%x\n" 3203 得到c83,补全16进制0xc83
4.5. 查看快照中线程 在刚才的栈快照中找0xc83 对应的日志view stack.log,搜索0xc83
1
2
3
4
5
6
7
8
9
10
11
12
13
14
15
16
17
18
19
20
21
22
23
24
25
26
27
28
29
30
31
32
33
34
35
36
37
38
39
40
41
42
43
44
45
46
47
48
49
50
51
52
53
54
Full thread dump OpenJDK 64-Bit Server VM (25.412-b08 mixed mode): "Attach Listener" #30 daemon prio=9 os_prio=0 tid=0x00007f6de8001000 nid=0xcd1 waiting on condition [0x0000000000000000] java.lang.Thread.State: RUNNABLE "DestroyJavaVM" #29 prio=5 os_prio=0 tid=0x00007f6e5804b800 nid=0xc59 waiting on condition [0x0000000000000000] java.lang.Thread.State: RUNNABLE "HighCpu" #28 prio=5 os_prio=0 tid=0x00007f6e5820b000 nid=0xc83 runnable [0x00007f6e20ea5000] java.lang.Thread.State: RUNNABLE at T2CPUFull.lambda$main$1(T2CPUFull.java:19) at T2CPUFull$$Lambda$2/303563356.run(Unknown Source) at java.lang.Thread.run(Thread.java:750) "Service Thread" #17 daemon prio=9 os_prio=0 tid=0x00007f6e58150800 nid=0xc77 runnable [0x0000000000000000] java.lang.Thread.State: RUNNABLE "C1 CompilerThread11" #16 daemon prio=9 os_prio=0 tid=0x00007f6e5814b800 nid=0xc76 waiting on condition [0x0000000000000000] java.lang.Thread.State: RUNNABLE # 省略了部分C1 CompilerThread ...... "Signal Dispatcher" #4 daemon prio=9 os_prio=0 tid=0x00007f6e58124800 nid=0xc6a runnable [0x0000000000000000] java.lang.Thread.State: RUNNABLE "Finalizer" #3 daemon prio=8 os_prio=0 tid=0x00007f6e580f8800 nid=0xc69 in Object.wait() [0x00007f6e22ceb000] java.lang.Thread.State: WAITING (on object monitor) at java.lang.Object.wait(Native Method) - waiting on <0x00000000d7588f00> (a java.lang.ref.ReferenceQueue$Lock) at java.lang.ref.ReferenceQueue.remove(ReferenceQueue.java:144) - locked <0x00000000d7588f00> (a java.lang.ref.ReferenceQueue$Lock) at java.lang.ref.ReferenceQueue.remove(ReferenceQueue.java:165) at java.lang.ref.Finalizer$FinalizerThread.run(Finalizer.java:188) "Reference Handler" #2 daemon prio=10 os_prio=0 tid=0x00007f6e580f4000 nid=0xc68 in Object.wait() [0x00007f6e22dec000] java.lang.Thread.State: WAITING (on object monitor) at java.lang.Object.wait(Native Method) - waiting on <0x00000000d7586b98> (a java.lang.ref.Reference$Lock) at java.lang.Object.wait(Object.java:502) at java.lang.ref.Reference.tryHandlePending(Reference.java:191) - locked <0x00000000d7586b98> (a java.lang.ref.Reference$Lock) at java.lang.ref.Reference$ReferenceHandler.run(Reference.java:153) "VM Thread" os_prio=0 tid=0x00007f6e580ea000 nid=0xc67 runnable "GC task thread#0 (ParallelGC)" os_prio=0 tid=0x00007f6e5805e000 nid=0xc5a runnable # 省略了GC task thread#1-11 ...... "GC task thread#12 (ParallelGC)" os_prio=0 tid=0x00007f6e58074800 nid=0xc66 runnable "VM Periodic Task Thread" os_prio=0 tid=0x00007f6e58153000 nid=0xc78 waiting on condition JNI global references: 310
主要看0xc83对应的数据,
1
2
3
4
5
"HighCpu" #28 prio=5 os_prio=0 tid=0x00007f6e5820b000 nid=0xc83 runnable [0x00007f6e20ea5000] java.lang.Thread.State: RUNNABLE at T2CPUFull.lambda$main$1(T2CPUFull.java:19) at T2CPUFull$$Lambda$2/303563356.run(Unknown Source) at java.lang.Thread.run(Thread.java:750)
这里就可以看出来,是T2CPUFull.java:19也就是第19行这里的问题
4.6. 说明 实际排查问题的时候jstack建议打印3-5次,根据多次的堆栈内容,再结合相关代码段进行分析,定位高cpu出现的原因,高cpu可能是代码段中某个bug导致的而不是堆栈打印出来的那几行导致的。
排查JVM问题除了使用Java自带的之外,还可以使用 arthas ,这里只说明了使用Jdk自带的工具排查
5. 内存占用过高排查 5.1. 方式一:自动获取dump文件并分析 5.1.1. 准备环境 准备一段代码,vim 新建T3MemoryFull.java就可以了
1
2
3
4
5
6
7
8
9
10
11
12
13
14
15
16
17
18
19
20
21
public class T3MemoryFull { public static void main (String[] args) throws InterruptedException { List<LargeObject> list = new HighMemory <>(); Thread thread = new Thread (() -> { while (true ) { list.add(new LargeObject ()); } }); thread.setName("HighMemory" ); thread.start(); Thread.sleep(100 * 1000 ); } static class HighMemory <T> extends ArrayList <T> { } static class LargeObject { private byte [] data = new byte [1024 ]; } }
然后Javac编译
得到T3MemoryFull.calss文件
5.1.2. 后台运行 1 nohup java -Xms256m -Xmx256m -XX:+HeapDumpOnOutOfMemoryError -XX:HeapDumpPath=/root/heapdump.hprof T3MemoryFull &
这样运行之后我们是来不及查看堆栈等信息的,程序会在出现OutOfMemoryError时自动记录下heapdump.hprof文件
5.1.3. 分析 我们已经拿到了dump文件了,可以通过jhat运行来查看
1 jhat /root/heapdump.hprof
这时,服务会起7000的端口,日志如下(访问不了的话请检查防火墙)
1
2
3
4
5
6
7
8
9
[root@main ~]# jhat heapdump.hprof Reading from heapdump.hprof... Snapshot read, resolving... Resolving 472243 objects... Chasing references, expect 94 dots.............................................................................................. Eliminating duplicate references.............................................................................................. Snapshot resolved. Started HTTP server on port 7000 Server is ready.
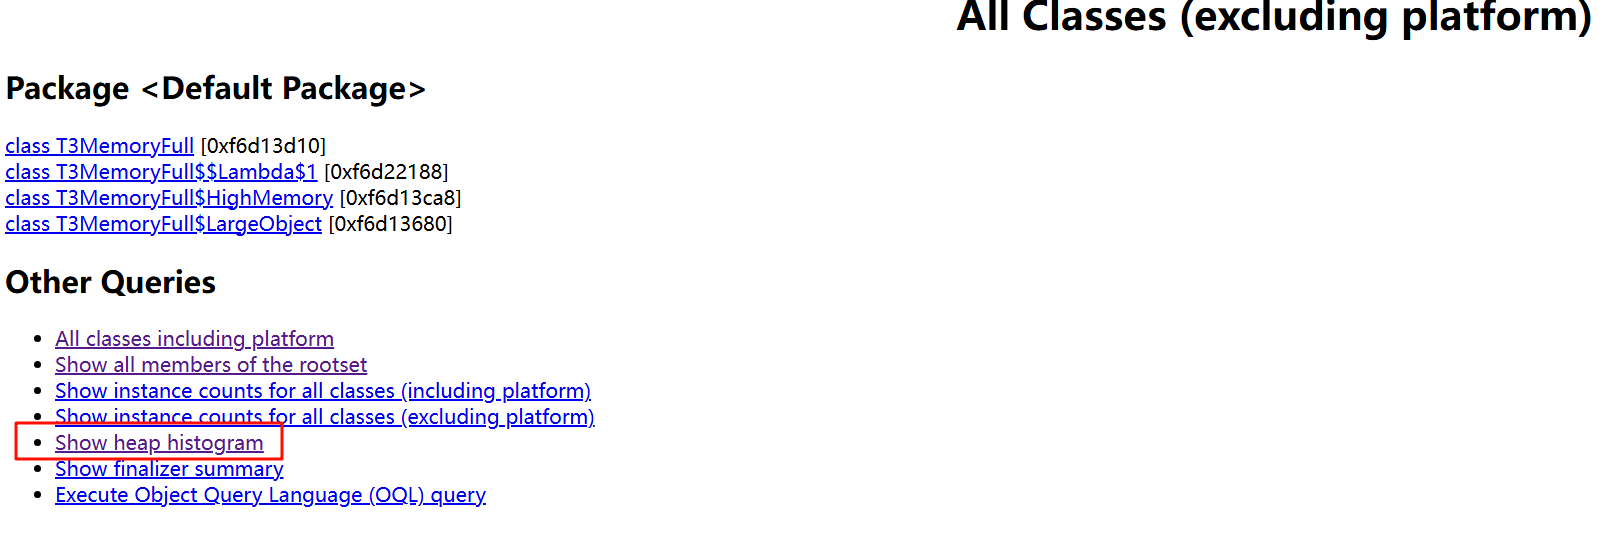
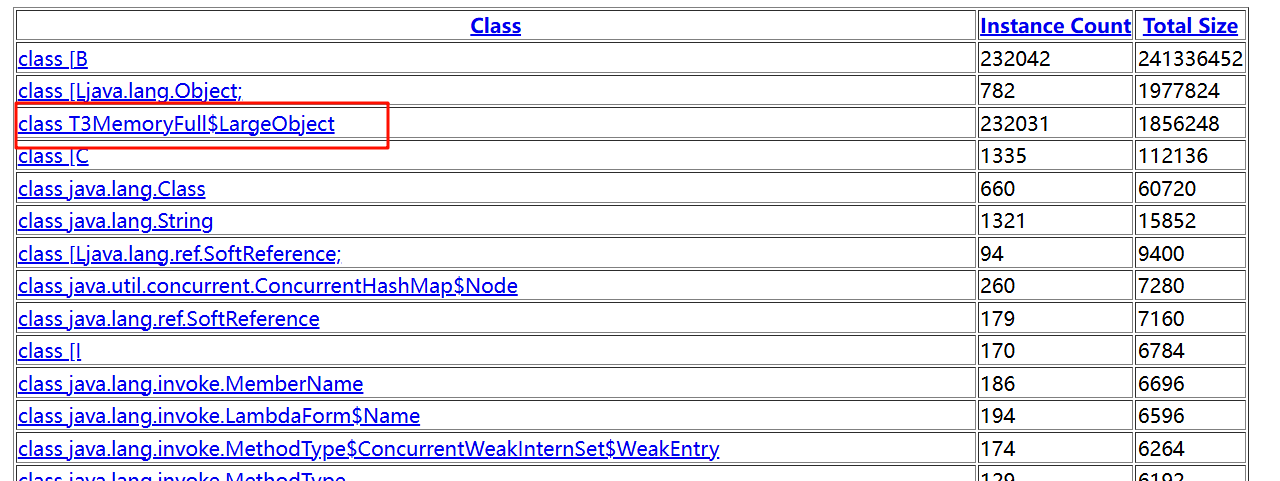
进入页面,可以看到信息页Show heap histogramclass T3MemoryFull$LargeObject这就是我们添加在数组的大对象了class [B这代表的字节数组的大小,LargeObject 中就初始化了很多
分析出来了大对象了,接下来就看哪里引用了这些对象,大致就能排查出来了HighMemory对象引用的
5.2. 方式二 通过命令获取 5.2.1. 准备 1 2 3 4 5 6 7 8 9 10 11 12 13 14 15 16 17 18 19 20 21 22 public class T3MemoryFull { public static void main (String[] args) throws InterruptedException { List<LargeObject> list = new HighMemory <>(); Thread thread = new Thread (() -> { while (true ) { list.add(new LargeObject ()); } }); thread.setName("HighMemory" ); thread.start(); Thread.sleep(100 * 1000 ); System.out.println(list.size()); } static class HighMemory <T> extends ArrayList <T> { } static class LargeObject { private byte [] data = new byte [1024 ]; } }
然后执行 javac T3MemoryFullnohup java T3MemoryFull &
5.2.2. 分析 使用top获取内存大的Java进程ID
执行jmap -histo 6728
1 2 3 4 5 6 7 8 9 10 11 12 13 14 15 16 17 18 19 20 21 22 23 24 25 26 27 28 num #instances #bytes class name 1: 1678586 1745742240 [B 2: 1678574 26857184 T3MemoryFull$LargeObject 3: 778 7328360 [Ljava.lang.Object; 4: 1344 116744 [C 5: 665 76488 java.lang.Class 6: 1330 31920 java.lang.String 7: 186 10416 java.lang.invoke.MemberName 8: 260 8320 java.util.concurrent.ConcurrentHashMap$Node 9: 179 7160 java.lang.ref.SoftReference 10: 167 6488 [I 11: 17 6392 java.lang.Thread 12: 194 6208 java.lang.invoke.LambdaForm$Name 13: 256 6144 java.lang.Long 14: 94 5640 [Ljava.lang.ref.SoftReference; 15: 174 5568 java.lang.invoke.MethodType$ConcurrentWeakInternSet$WeakEntry 16: 129 5160 java.lang.invoke.MethodType 17: 256 4096 java.lang.Byte 18: 256 4096 java.lang.Integer 19: 256 4096 java.lang.Short 20: 119 4088 [Ljava.lang.Class; 21: 111 3552 java.util.Hashtable$Entry 22: 67 3040 [Ljava.lang.invoke.LambdaForm$Name; 23: 62 2976 java.lang.invoke.LambdaForm 24: 28 2912 [Ljava.lang.invoke.MethodHandle; 25: 49 2744 java.lang.invoke.MethodTypeForm 26: 97 2328 java.lang.invoke.LambdaForm$NamedFunction
就可以得到和方式一一样的结果
6. 总结 其实检查JVM问题,主要使用好以下命令
top 查看系统进程,可以检查进程状态(cpu和内存)top -Hp <进程pid>查看进程中线程状态(cpu和内存),可以具体定位到线程(注意将得打的线程id转换为16进制)jstack <进程pid>获取当前进程的线程快照,线程状态就可以看见了,通过线程的16进制ID可以定位到具体的位置获取线程信息jmap 获取当前进程的堆信息,可以得到dump文件,也可以直接检查堆信息jhat 启动服务检视dump文件
其实,并不是很难,至少方法在这里,具体问题再具体分析。
7. 其他工具 除了使用命令行,也可以使用jconsole可视化工具,jdk提供,直观的检视进程信息